Alle Kategorien
-
Integrierte schaltkreise (ICS)
Integrierte schaltkreise (ICS)
- Spezialisierte ICS(35707)
- PMIC-Spannungsregler-besonderer Zweck(1598)
- PMIC-Spannungsregler-lineare Regler(572)
- PMIC-Spannungsregler-linear + Switching(499)
- PMIC-Spannungsregler-linear(27467)
- PMIC-Spannungsregler-DC DC Switching Regulators(20868)
- PMIC-Regler-DC-DC-Switching-Controller(4728)
- PMIC-Spannungs-Referenz(2128)
- PMIC-v/f und f/v-Wandler(47)
- PMIC-Thermal Management(297)
- PMIC-Supervisor(17396)
- PMIC-RMS bis DC-Wandler(555)
- PMIC-Netzteil-Controller, Monitore(723)
- PMIC-Power over Ethernet (PoE) Controller(368)
- PMIC-Power Management-spezialisierte(2708)
- PMIC-Netzschalter, Treiber laden(1429)
- PMIC-PFC (Power Factor Correction)(320)
- PMIC oder Steuerungen, ideale Dioden(290)
- PMIC-Motor-Treiber, Regler(1166)
- PMIC-Beleuchtung, Ballast-Regler(1745)
- PMIC-LED-Treiber(11607)
- PMIC-Laser-Treiber(2349)
- PMIC-Hot-Swap-Controller(2468)
- PMIC-Gate-Treiber(5085)
- PMIC-voll, Half-Bridge-Treiber(364)
- PMIC-Energy Messung(2378)
- PMIC-Display-Treiber(4466)
- PMIC-derzeitige Regulierung/Management(732)
- PMIC-Batterie-Management(3519)
- PMIC-Ladegeräte(46080)
- PMIC-AC DC Konverter, Offline Schalter(21202)
- Memory-Controller(9982)
- Memory-Konfigurations-Proms für FPGAs(7695)
- Speicher-Akkus(130)
- Memory(19527)
- Memory(19527)
- Logic-universelle Bus-Funktionen(31014)
- Logic-Übersetzer, Level-Shifter(755)
- Logik-Specialty Logic(1916)
- Logik-Signal-Schalter, Multiplexer, Decoder(3447)
- Logic-Shift-Register(6058)
- Logic-Parity Generatoren und Checkers(6682)
- Logic-multivibratoren(1274)
- Logik-Latches(1535)
- Logik - Tore und Wechselrichter - Multifunktion, konfigurierbar(4223)
- Logik-Tore und Wechselrichter(5667)
- Logic-Flip Flops(7964)
- Logik-FIFOs Speicher(1236)
- Logik-Zähler, Trennlinien(3350)
- Logik-Vergleichsoperator(5892)
- Logik-Puffer, Treiber, Receiver, Transceiver(6630)
- Linear-Video-Verarbeitung(1075)
- Linear-Vergleichsoperator(2312)
- Linear-analoge Multiplikatoren, Trennwände(1237)
- Linear-Verstärker-Video Amps und Module(3822)
- Linear-Verstärker-Spezial-Zweck(3334)
- Linear - Verstärker - Instrumentierung, OP -Verstärker, Pufferverstärker(11463)
- Linear-Verstärker-Audio(971)
- Interface-Voice Record und Playback(634)
- Schnittstelle - UARTs (Universal Asynchronous Receivers -Sender)(133)
- Schnittstelle-Telecom(47636)
- Interface-spezialisierte(1301)
- Interface-Signal Terminatoren(2351)
- Interface-Signal-Puffer, Repeater, Splitter(1834)
- Interface-Serializer, Deserializer(7226)
- Schnittstellen-Sensor und Detektor-Interfaces(2321)
- Interface-Module(230)
- Interface-Modems-ICS und Module(668)
- Interface-e/a-Expander(2822)
- Interface-Filter-aktiv(1524)
- Interface-Encoder, Decoder, Konverter(11802)
- Interface-Treiber, Receiver, Transceiver(10390)
- Interface-Direct Digital Synthesis (DDS)(3471)
- Interface-Controller(3245)
- Interface-Codecs(583)
- Schnittstelle - Analoge Switches, Multiplexer, Demultiplexer(15690)
- Schnittstelle-analoge Schalter-spezieller Zweck(2961)
- Embedded-System on Chip (SoC)(6429)
- Embedded-PLDs (programmierbare Logik-Vorrichtung)(613)
- Embedded-Mikroprozessoren(5164)
- Embedded-Mikrocontroller-anwendungsspezifische(2091)
- Embedded-Mikrocontroller(59305)
- Eingebettet - Mikrocontroller, Mikroprozessor, FPGA -Module(4518)
- Eingebettet - FPGAs (Feldprogrammiergate -Array) mit Mikrocontrollern(557)
- Embedded-FPGAs (Field Programmable Gate Array)(7189)
- Embedded-DSP (Digital Signal Processors)(4650)
- Eingebettet - CPLDs (komplexe programmierbare Logikgeräte)(4971)
- Datenerfassung-Touch Screen Controller(596)
- Datenerfassung-Digital to Analog Converter (DAC)(5044)
- Datenerfassung-digitale Potentiometer(1879)
- Datenerfassung-analog zu Digital Converters (ADC)(5134)
- Datenerfassung-analoges Frontend (AFE)(227)
- Datenerfassung-MDE/DACs-spezieller Zweck(922)
- Clock/Timing-Uhren in Echtzeit(1372)
- Uhr/Timing - programmierbare Timer und Oszillatoren(1504)
- Clock/Timing-IC-Akkus(492)
- Takt/Timing-Delay Lines(16538)
- Uhr/Timing - Uhrengeneratoren, PLLS, Frequenzsynthesizer(20093)
- Clock/Timing-Clock Puffer, Treiber(3531)
- Clock/Timing-anwendungsspezifische(3433)
- Audio Spezial-Zweck(9718)
-
Diskrete Halbleiter-Produkte
Diskrete Halbleiter-Produkte
- Aktuelle Regulierung - Dioden, Transistoren(775)
- Transistoren-besonderer Zweck(64)
- Transistoren-programmierbare Unijunction(1584)
- Transistoren-jfets(1690)
- Transistoren-IGBTs-Einzel(6032)
- Transistoren-IGBTs-Module(1087)
- Transistoren-IGBTs-Arrays(9)
- Transistoren-FETs, MOSFETs-Einzel(16037)
- Transistoren-FETs, MOSFETs-RF(3251)
- Transistoren-FETs, MOSFETs-Arrays(6376)
- Transistoren-Bipolar (BJT)-einzeln, Pre-biased(4478)
- Transistoren-Bipolar (BJT)-Einzel(12624)
- Transistoren-Bipolar (BJT)-RF(488)
- Transistoren-bipolare (BJT)-Arrays, Pre-biased(6311)
- Transistoren-bipolare (BJT)-Arrays(1394)
- Thyristor-triacs(1128)
- Thyristoren-SCRs-Module(1141)
- Thyristoren-SCRs(2752)
- Thyristoren-diacs, sidacs(164)
- Power Driver Module(4744)
- Dioden-zenerdioden-Einzel(43480)
- Dioden-zenerdioden-Arrays(113195)
- Dioden - variable Kapazität (Varik, Varaktoren)(718)
- Dioden-RF(1765)
- Dioden-Gleichrichter-Einzel(31894)
- Dioden-Gleichrichter-Arrays(8627)
- Dioden-Brücke-Gleichrichter(20238)
-
RF/if und RFID
RF/if und RFID
- SIM -Karten für Abonnenten -Identifikationsmodul (SIM)(41)
- RF -Zirkulatoren und Isolatoren(1721)
- RFID Zubehör(350)
- HF-Zubehör(2025)
- RFID, RF-Zugang, Monitoring-ICS(4567)
- RFID Transponder, Tags(240)
- RFID Lesegeräte(1877)
- RFID Evaluation und Development Kits, Boards(67)
- RFID Evaluation und Development Kits, Boards(67)
- RFID Antennen(696)
- RFI und EMI - Abschirm- und Absorbungsmaterialien(8538)
- HF und EMI-Kontakte, Fingerstock und Dichtungen(4004)
- RF Transmitter(1179)
- RF Transceiver Module(4056)
- RF-Transceiver ICS(1553)
- HF-Schalter(8107)
- RF Shields(4991)
- HF-Receiver(639)
- HF -Empfänger, Sender und Transceiver -Einheiten(3515)
- RF Power Divider/Splitter(4268)
- RF Power Controller ICs(595)
- HF-Modulatoren(3958)
- HF-Mixer(4622)
- RF misc ICS und Module(2738)
- HF-Front-End (LNA + PA)(11681)
- HF Evaluation und Development Kits, Boards(1994)
- HF Evaluation und Development Kits, Boards(1994)
- HF-gerichtete Kupplung(2963)
- RF Diplexer(1406)
- RF-Detektoren(175)
- RF-Demodulatoren(256)
- HF-Antennen(7488)
- HF-Verstärker(17487)
- Balun(706)
- Dämpfungsglieder(3204)
-
Optoelektronik
Optoelektronik
- Optomechanisch(338)
- Leuchten(125)
- Laserdioden, Lasermodule - Laserlieferung, Laserfasern(325)
- Hene Lasersysteme(24)
- Hene Lasersystemzubehör(9)
- Hene Laserköpfe(16)
- Hintergrundbeleuchtung anzeigen(31)
- Laserdioden, Module - Zubehör(36)
- Zubehör(42476)
- Zubehör(42476)
- Xenon-Beleuchtung(549)
- Touchscreen-Overlays(249048)
- Panel Indicators, Pilot Lights(47475)
- Optik-Remote-Phosphor-Lichtquelle(2771)
- Optik-Reflektoren(145)
- Optik-leichte Rohre(3353)
- Optik-Objektive(15458)
- LEDs-Spacer, Unentschieden(433)
- LEDs-Lamp-Ersetzungen(24316)
- LEDs - Leiterplattenindikatoren, Arrays, Lichtstäbe, Balkendiagramme(1922)
- LED-thermische Produkte(6703)
- LED-Beleuchtung(39)
- LED-Beleuchtung-weiß(13461)
- LED-Beleuchtung-Farbe(2210)
- LED-Beleuchtung-Maiskolben, Motoren, Module(9508)
- LED-Anzeige-diskret(10227)
- Laserdioden, Module(1345)
- Lampen-Glühlampen, Neons(338506)
- Lampen-Kälte-Fluoreszenz (KKL) & UV(349)
- Wechselrichter(7962)
- Infrarot, UV, sichtbare Strahler(3759)
- Fiber Optics-Transmitter-Antrieb integriert(3523)
- Fiber Optics-Transmitter-diskrete(2743)
- Fiber Optics-Transceiver Module(22925)
- Fiberoptik-Switches, Multiplexer, Demultiplexer(8234)
- Fiberoptik-Receiver(853)
- Fiberoptik-Dämpfung(394)
- Elektrolumineszenz(24758)
- Display, Monitor-Interface Controller(2642)
- Display-Module-Vakuum-Leuchtstofflampen (VFD)(19327)
- Module anzeigen-LED Dot Matrix und Cluster(17654)
- Display-Module-LED-Zeichen und numerische(2162)
- Display-Module-LCD, OLED, Graphic(3487)
- Display-Module-LCD, OLED-Zeichen und numerische(790)
- Display-Blenden, Objektive(288)
- Adresse, Spezialität(2442)
-
Sensoren, Wandler
Sensoren, Wandler
- Ultraschallempfänger, Sender - Industrial(115)
- Temperatursensoren - Thermostate - Mechanisch - Industrielles(1270)
- Temperatursensoren - Analog und digitaler Ausgang - Industrial(169)
- Näherungssensoren - Industrial(7143)
- Drucksensoren, Wandler - Industrie(1835)
- Optische Sensoren - Photonik - Zähler, Detektoren, SPCM (Einzelphotonzählmodul)(726)
- Optische Sensoren - Kameramodule(776)
- Magnetsensoren - Position, Nähe, Geschwindigkeit (Module) - Industrie(138)
- Kraftsensoren - Industrial(265)
- Flusssensoren - Industrielles(137)
- Float, Level Sensoren - Industrial(172)
- Encoder - Industrial(2217)
- Farbsensoren - Industrial(20)
- Berührungssensoren(63)
- Messkabel-Zubehör(2553)
- Zubehör(4528)
- Zubehör(4528)
- Ultraschall-Receiver, Transmitter(986)
- Temperatursensoren-Thermostat-Solid State(333)
- Temperatursensoren-Thermostate-mechanisch(4379)
- Temperatursensoren - Thermoelemente, Temperatursonden(1770)
- Temperatursensoren - RTD (Widerstandstemperaturdetektor)(1653)
- Temperatursensoren-PTC-Thermistoren(2026)
- Temperatursensoren-ntc-thermistoren(7932)
- Temperatursensoren-Analog und Digital Output(2963)
- DMS(1886)
- Spezialisierte Sensoren(3142)
- Solarzellen(688)
- Schock-Sensoren(317)
- Sensor-Interface-Junction-Blöcke(2156)
- Sensor-Kabel-Baugruppen(26522)
- Proximity/Belegung Sensoren-fertige Einheiten(902)
- Näherungsschalter(3322)
- Drucksensoren, Wandler(10275)
- Positionssensoren - Winkel, lineare Positionsmessung(3882)
- Optische Sensoren-reflektierende-Logik-Ausgang(1471)
- Optische Sensoren - reflektierend - analoge Ausgang(1258)
- Optische Sensoren-Phototransistoren(1032)
- Optische Sensoren - Photointerrupter - Schlitztyp - Transistorausgang(513)
- Optische Sensoren - Photointerrupter - Schlitztyp - Logikausgabe(559)
- Optische Sensoren-Lichtschranke, Industrial(12132)
- Optische Sensoren-Photodioden(3168)
- Optische Sensoren-Foto-Detektoren-Remote Receiver(1350)
- Optische Sensoren-Foto-Detektoren-Logik-Ausgang(339)
- Optische Sensoren-Foto-Detektoren-CDs-Zellen(717)
- Optische Sensoren-Maus(1297)
- Optische Sensoren-Distanz-Messung(1412)
- Optische Sensoren-Ambient Light, IR, UV Sensoren(10243)
- Multifunktions(1418)
- Motion Sensors-Vibration(1680)
- Motion Sensors-Tilt Schalter(159)
- Bewegungsmelder-optisch(347)
- Motion Sensors-Neigungssensoren(102)
- Motion Sensors-Imus (Trägheit-Maßeinheiten)(298)
- Motion Sensors-Kreisel(702)
- Motion Sensors-Beschleunigungsmesser(764)
- Magnete-Sensor abgestimmt(152)
- Magnete-Multi Purpose(1871)
- Magnetische Sensoren-Schalter (Solid State)(1519)
- Magnetsensoren - Position, Nähe, Geschwindigkeit (Module)(2148)
- Magnetische Sensoren-linear, Kompass (ICS)(698)
- Magnetsensoren - Kompass, Magnetfeld (Module)(178)
- LVDT -Wandler (linearer variabler Differentialtransformator)(1451)
- IrDA Transceiver-Module(77)
- Bildsensor, Kamera(1272)
- Feuchtigkeit-Sensoren(3880)
- Gas-Sensoren(4294)
- Force Sensoren(1023)
- Durchfluss-Sensoren(440)
- Float, Level Sensoren(634)
- Flex-Sensoren(157)
- Encoder(3440)
- Staub-Sensoren(388)
- Aktuelle Wandler(2256)
- Color Sensoren(49)
- Schnittstelle - Sensor, kapazitive Berührung(356)
- Verstärker(2000)
- Verstärker(2000)
-
Anschlüsse, Verbindungen
Anschlüsse, Verbindungen
- Stecker und Behälter(1710)
- USB, DVI, HDMI Stecker-Zubehör(94)
- Klemmen-Zubehör(113)
- Anschlussblöcke-Zubehör-Draht-Beschläge(1061)
- Anschlussblöcke-Zubehör-Marker-Streifen(4696)
- Anschlussblöcke-Zubehör-Jumper(1477)
- Anschlussblöcke-Zubehör(3886)
- Solid State Lighting Steckverbinder-Zubehör(96)
- Buchsen für ICS, Transistoren-Zubehör(71)
- Rechteckige Steckverbinder-Zubehör(2950)
- Rechteckig-Platine-Stecker-Zubehör(1)
- Power Entry Steckverbinder-Zubehör(329)
- Austauschbare Steckverbinder-Zubehör(204)
- Photovoltaik (Solarpanel) Stecker - Zubehör(99)
- Modulare Anschlüsse - Kabelblöcke - Zubehör(22)
- Modulare Steckverbinder-Zubehör(276)
- Memory Steckverbinder-Zubehör(57)
- Keystone-Zubehör(357)
- Heavy Duty Steckverbinder-Zubehör(1081)
- LWL-Steckverbinder - Zubehör(349)
- FFC, FPC (flache flexible) Steckverbinder - Zubehör(8)
- D -Sub, D -förmige Steckverbinder - Zubehör - JackScrews(830)
- D-Sub, d-förmige Steckverbinder-Zubehör(1168)
- Koaxial Verbinder (RF)-Zubehör(1017)
- Rundsteckverbinder-Zubehör(48982)
- Card Edge Steckverbinder-Zubehör(99)
- Blade Type Power Connectors-Zubehör(670)
- Fass-Zubehör(74)
- Banana and Tip Steckverbinder-Zubehör(25)
- Backplane Steckverbinder-Zubehör(693)
- USB, DVI, HDMI Stecker-Adapter(45761)
- USB, DVI, HDMI Stecker(3377)
- USB, DVI, HDMI Stecker(3377)
- Klemmen-Wire to Board Steckverbinder(1604)
- Klemmen-Draht-Steckverbinder(40747)
- Klemmen-Draht-Pin Stecker(12531)
- Terminals-Revolver Steckverbinder(5553)
- Terminals-spezialisierte Steckverbinder(1300)
- Klemmen-Spaten Verbinder(1381)
- Klemmen-Löten/Stecker(2577)
- Klemmen-Verschraubungen(1980)
- Klemmen-Ring Steckverbinder(6682)
- Klemmen-rechteckige Steckverbinder(3878)
- Terminals - Schnellverbindungen, schnelle Trennungsanschlüsse(4695)
- Klemmen-PC PIN, Single Post Connectors(2149)
- Klemmen-PC-Pin-Buchsen, Sockel-Steckverbinder(2222)
- Klemmen-magnetische Draht-Steckverbinder(3357)
- Klemmen-Messer Steckverbinder(3829)
- Klemmen-Gehäuse, Stiefel(1891)
- Klemmen-Folie Steckverbinder(662)
- Klemmen-Barrel, Bullet-Steckverbinder(5430)
- Klemmen-Adapter(713)
- Terminal-Streifen und Revolver-Boards(11368)
- Terminal Junction Systeme(3288)
- Anschlussblöcke-Draht an Bord(19352)
- Terminal Blocks-spezialisierte(2960)
- Terminal Blocks-Power Distribution(499)
- Anschlussblöcke-Panel Mount(522)
- Terminal Blocks-Interface Module(1639)
- Anschlussblöcke-Kopfzeilen, Stecker und Buchsen(148192)
- Anschlussblöcke-DIN-Schiene, Kanal(10920)
- Anschlussblöcke-Kontakte(306247)
- Anschlussblöcke-Barrier Blocks(44736)
- Anschlussblöcke-Adapter(449)
- Solid State Lighting Verbinder-Kontakte(2509)
- Solid State Lighting Steckverbinder(2295)
- Solid State Lighting Steckverbinder(2295)
- Buchsen für ICS, Transistoren-Adapter(765)
- Buchsen für ICS, Transistoren(2223)
- Buchsen für ICS, Transistoren(2223)
- Shunts, Jumper(821)
- Rechteckige Verbinder-Feder geladen(8043)
- Rechteckige Steckverbinder-Gehäuse(28877)
- Rechteckige Verbinder-Kopfzeilen, Spezial-PIN(5397)
- Rechteckige Anschlüsse - Header, Gefäße, weibliche Sockel(23450)
- Rechteckige Verbinder-Kopfzeilen, männliche Pins(138439)
- Rechteckige Anschlüsse - kostenloses Hängen, Panelhalterung(15074)
- Rechteckige Verbinder-Kontakte(5477)
- Rechteckige Anschlüsse - Board in, Direktdraht zum Board(2459)
- Rechteckige Verbinder-Adapter(251)
- Rechteckig - Brett zu Board -Steckern - Header, Behälter, weibliche Sockel(2982)
- Rechteckig - Brett zu Board -Steckern - Header, männliche Stifte(239)
- Rechteckige Anschlüsse - Board -Abstandshalter, Stacker (Board zu Board)(27782)
- Rechteckige Anschlüsse - Arrays, Kantentyp, Mezzanin (Board zu Board)(14186)
- Stromanschluss-Eingänge, Steckdosen, Module(4831)
- Austauschbare Steckverbinder(5229)
- Austauschbare Steckverbinder(5229)
- Photovoltaik- (Solarpanel) Anschlüsse - Kontakte(69363)
- Photovoltaik (Solar Panel) Steckverbinder(365)
- Photovoltaik (Solar Panel) Steckverbinder(365)
- Modulare Steckverbinder-Verdrahtung Blöcke(653)
- Modulare Steckverbinder-Stecker(2164)
- Modulare Steckverbinder-Stecker Gehäuse(3582)
- Modulare Steckverbinder-Buchsen mit magnetischen(4193)
- Modulare Steckverbinder-Buchsen(15464)
- Modulare Steckverbinder-Adapter(503)
- Memory Connectors-PC Cards-Adapter(859)
- Memory Connectors-PC Card Sockets(1904)
- Memory Connectors-Inline Modul Sockets(2493)
- LGH Steckverbinder(1057)
- Keystone-Einsätze(8467)
- Keystone-Frontplatte, Frames(19410)
- Heavy Duty Steckverbinder-Einsätze, Module(213354)
- Schwerlastanschlüsse - Gehäuse, Kapuzen, Basen(449460)
- Heavy Duty Steckverbinder-Frames(16851)
- Heavy Duty Steckverbinder-Kontakte(6325)
- Heavy Duty Steckverbinder-Baugruppen(1730)
- LWL-Steckverbinder-Gehäuse(4852)
- Glasfaser-Steckverbinder - Adapter(2754)
- LWL-Steckverbinder(215502)
- FFC, FPC (flache flexible) Steckverbinder - Gehäuse(30189)
- FFC, FPC (flache flexible) Anschlüsse - Kontakte(114)
- FFC, FPC (flache flexible) Steckverbinder(12920)
- FFC, FPC (flache flexible) Steckverbinder(12920)
- D-Sub, d-förmige Steckverbinder-Terminatoren(640)
- D-Sub, d-förmige Steckverbinder-Gehäuse(12383)
- D-Sub, d-förmige Steckverbinder-Kontakte(1350)
- D-Sub, D-förmige Steckverbinder-Rückenschalen, Kapuzen(3078)
- D-Sub, d-förmige Steckverbinder-Adapter(976)
- D-Sub Steckverbinder(106471)
- D-förmige Steckverbinder-Centronics(6037)
- Kontakte, Frühling geladen und Druck(7921)
- Kontakte-Multi Purpose(16222)
- Kontakte-"Leadframe"(572)
- Koaxial-Steckverbinder (RF)-Terminatoren(1374)
- Koaxial-Steckverbinder (RF)-Kontakte(279)
- Koaxial-Steckverbinder (RF)-Adapter(5909)
- Koaxial-Steckverbinder (RF)(16068)
- Koaxial-Steckverbinder (RF)(16068)
- Rundsteckverbinder-Gehäuse(221760)
- Rundsteckverbinder-Kontakte(3377)
- Rundsteckverbinder-backschalen und Kabel-Klemmen(44820)
- Rundsteckverbinder-Adapter(7708)
- Rundsteckverbinder(771637)
- Rundsteckverbinder(771637)
- Card Edge Steckverbinder-Gehäuse(577)
- Karte Edge Verbinder-edgeboard Verbinder(497865)
- Card Edge Verbinder-Kontakte(527)
- Card Edge Verbinder-Adapter(2752)
- Blade Type Power Steckverbinder-Gehäuse(2290)
- Blade Type Power Connectors-Kontakte(715)
- Blade-Typ-Stecker(2373)
- Blade-Typ-Stecker(2373)
- Zwischen Serien-Adapter(289)
- Barrel-Stromanschluss(399)
- Barrel-Audio-Anschlüsse(10808)
- Barrel-Audio Adapter(54)
- Banana und Tip Steckverbinder-Buchsen, Stecker(2046)
- Banana and Tip Connectors-Binding Posts(3219)
- Banana und Tip Steckverbinder-Adapter(647)
- Backplane Steckverbinder-spezialisiert(33926)
- Backplane Steckverbinder-Gehäuse(47465)
- Backplane Steckverbinder-Hard metrisch, Standard(7596)
- Backplane Steckverbinder-DIN 41612(4684)
- Backplane Steckverbinder-Kontakte(4419)
- Backplane Connectors-ARINC Einsätze(2322)
- Backplane Steckverbinder-ARINC(3305)
-
Widerstände
-
Kondensatoren
Kondensatoren
- Zubehör(50)
- Zubehör(50)
- Trimmer, Variable Kondensatoren(1088)
- Dünne Folien-Kondensatoren(1724)
- Tantal-Kondensatoren(79518)
- Tantal-Polymer-Kondensatoren(2486)
- Silizium-Kondensatoren(225)
- Niob Oxide Kondensatoren(128)
- Mica und PTFE Kondensatoren(908)
- Folien-Kondensatoren(89898)
- Elektrische Doppelschichtkondensatoren (EDLC), Superkondensatoren(1644)
- Keramische Kondensatoren(261123)
- Kondensatoren-Netzwerke, Arrays(740)
- Aluminium-Elektrolytkondensatoren(39501)
- Aluminium-Polymer-Kondensatoren(2396)
-
Transformatoren
Transformatoren
-
Isolatoren
-
Kristalle, Oszillatoren, Resonatoren
-
Switches
Switches
- Verriegelungsschalter(862)
- Emergency-Stop-Schalter (E-Stop)(752)
- Kabelzugschalter(353)
- Accessoires-Caps(1768)
- Zubehör-Stiefel, Dichtungen(106)
- Zubehör(11056)
- Zubehör(11056)
- Toggle-Schalter(18713)
- Rändelrads Schalter(1050)
- Schalter(9157)
- Snap-Aktion, Endschalter begrenzen(14916)
- Slide-Schalter(24680)
- Selector-Schalter(4460)
- Rotary Switches(5818)
- Rocker Schalter(60676)
- Drucktaste-Schalter-Hall-Effekt(3768)
- Drucktaste Schalter(29541)
- Programmierbare Display-Switches(13202)
- Navigations-Schalter, Joystick(14105)
- Magnetische, Reed-Schalter(604)
- Keypad-Schalter(168067)
- Keylock Schalter(1623)
- DIP Schalter(2977)
- Konfigurierbare Switch-Komponenten-Objektiv(1755)
- Konfigurierbare Schalter-Komponenten-Lichtquelle(1239)
- Konfigurierbare Switch-Komponenten-Contact Block(2781)
- Konfigurierbare Switch-Komponenten-Body(17732)
-
Relais
Relais
- Sicherheitsrelais(722)
- Reedrelais(484)
- Hochfrequenz (RF) -Relais(461)
- Schütze (Festkörper)(64)
- Schütze (elektromechanisch)(10945)
- Kfz-Relais(1280)
- Zubehör(2791)
- Zubehör(2791)
- Solid State Relais(3585)
- Signal-Relais, bis zu 2 Ampere(6811)
- Relay-Sockets(869)
- Power Relays, über 2 Ampere(369115)
- E / A-Relaismodule(593)
- I/o-Relay-Module-Input(30134)
- I/o-Relay-Module-Analog(438223)
- I/o-Relay-Modul-Racks(14318)
Sprache auswählen
Aktuelle Sprache
Deutsch
- English
- Deutsch
- Italia
- Français
- 日本語
- 한국의
- русский
- Svenska
- Nederland
- español
- Português
- polski
- Suomi
- Gaeilge
- Slovenská
- Slovenija
- Čeština
- Melayu
- Magyarország
- Hrvatska
- Dansk
- românesc
- Indonesia
- Ελλάδα
- Български език
- Afrikaans
- IsiXhosa
- isiZulu
- lietuvių
- Maori
- Kongeriket
- Монголулс
- O'zbek
- Tiếng Việt
- हिंदी
- اردو
- Kurdî
- Català
- Bosna
- Euskera
- العربية
- فارسی
- Corsa
- Chicheŵa
- עִבְרִית
- Latviešu
- Hausa
- Беларусь
- አማርኛ
- Republika e Shqipërisë
- Eesti Vabariik
- íslenska
- မြန်မာ
- Македонски
- Lëtzebuergesch
- საქართველო
- Cambodia
- Pilipino
- Azərbaycan
- ພາສາລາວ
- বাংলা ভাষার
- پښتو
- malaɡasʲ
- Кыргыз тили
- Ayiti
- Қазақша
- Samoa
- සිංහල
- ภาษาไทย
- Україна
- Kiswahili
- Cрпски
- Galego
- नेपाली
- Sesotho
- Тоҷикӣ
- Türk dili
- ગુજરાતી
- ಕನ್ನಡkannaḍa
- मराठी
Referenzhandbuch der Batteriespannung
Zeit: 2024/10/30
Durchsuchen: 1,770
Katalog
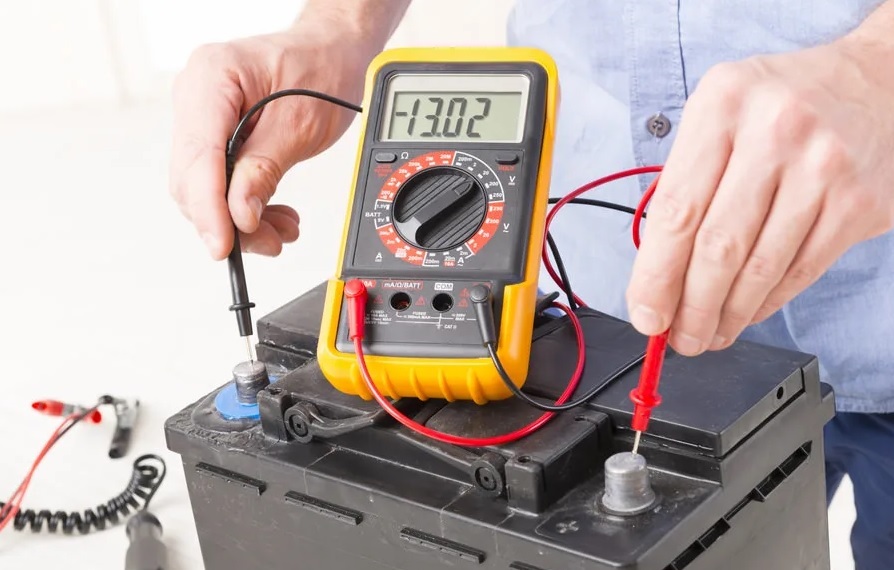
Verschiedene Blei-Säure-Batteriespannungsdiagramm
Bleibatterien gehören zu den ältesten und am weitesten verbreiteten Batterien, die häufig in nicht-netzunabhängigen Sonnensystemen enthalten sind.Es gibt zwei Primärtypen: überflutete Blei-Säure-Batterien (Bleisäure), auch als Nasszellen bezeichnet, und die Blei-Säure-Batterien für die Absorptionsmatte (AGM).Jedes hat unterschiedliche Merkmale, die die Wartungsanforderungen, Kosten und Leistung beeinflussen.
Überflutete Batteriespannungsdiagramm
FLA -Batterien sind die wirtschaftlichere Wahl, erfordern jedoch eine regelmäßige Wartung, einschließlich der Überprüfung des Wasserstandes und der Durchführung der Ausgleichskosten.Sie füllen beim Laden Wasserstoffgas frei, sodass eine ordnungsgemäße Belüftung erforderlich ist, um die Ansammlung von Dämpfen zu vermeiden.Trotz ihrer niedrigeren Vorabkosten neigen die FLA -Batterien dazu, sich schneller abzubauen als ihre AGM -Gegenstücke, insbesondere wenn sie nicht ordnungsgemäß gewartet werden.
Das Verständnis der Spannungseigenschaften einer überfluteten Blei-Säure-Batterie von 6 V ist entscheidend, um eine optimale Leistung und Langlebigkeit zu gewährleisten.Dieses Spannungsdiagramm enthält gute Informationen über den Ladungszustand der Batterie, die Entladung und die allgemeine Gesundheit.Wenn Sie sich auf dieses Diagramm beziehen, können Sie die Leistung ihrer Batterie genau überwachen, fundierte Entscheidungen bezüglich der Wartung treffen und die Effizienz ihrer Anwendungen verbessern.Unabhängig davon, ob Sie diese Batterien für erneuerbare Energiesysteme, Golfwagen oder andere Geräte verwenden, können Sie mit diesem Leitfaden die Spannungslesungen effektiv interpretieren.
|
Stromspannung |
Kapazität |
|
6.32v |
100% |
|
6.26v |
90% |
|
6,20 V |
80% |
|
6.15 V |
70% |
|
6.09v |
60% |
|
6.03v |
50% |
|
5.98v |
40% |
|
5.94v |
30% |
|
5.88v |
20% |
|
5.82v |
10% |
|
5.79v |
0% |
AGM-Blei-Säure-Batteriespannungstabelle
AGM-Batterien sind eine fortschrittlichere Version von Blei-Säure-Batterien, da sie versiegelt sind und weniger Wartung erfordern.Der Elektrolyt in AGM -Batterien wird in Glasfasermatten aufgenommen, wodurch das Risiko von Verschüttungen verringert und die Belüftungsbedürfnisse beseitigt werden.Sie bieten in der Regel längere Ladungszyklen und sind haltbarer. Damit sind sie zu einer beliebten Wahl für Solarsysteme, die eine zuverlässige Leistung mit minimalem Unterhalt benötigen.
|
Stromspannung |
Kapazität |
|
6.44v |
100% |
|
6.39v |
90% |
|
6.33v |
80% |
|
6.26v |
70% |
|
6,20 V |
60% |
|
6.11v |
50% |
|
6,05 V |
40% |
|
5.98v |
30% |
|
5.90V |
20% |
|
5.82v |
10% |
|
5.79v |
0% |
12 V Blei-Säure-Batteriespannungstabelle
In Solarsystemen sind 12-V-Blei-Säure-Batterien für ihre Erschwinglichkeit und Zuverlässigkeit beliebt.Die beiden Haupttypen sind AGM (versiegelt) und überflutete (FLA) -Batterien mit jeweils einzigartigen Spannungseigenschaften, die sich auf ihren Leistungs- und Wartungsbedarf auswirken.AGM -Batterien erfordern eine minimale Wartung, da sie versiegelt sind und keine Bewässerung oder Belüftung benötigen.Sie sind gut für geschlossene Räume geeignet und haben eine etwas höhere Vollspannung als überflutete Batterien.
- Vollladspannung: ~ 12,89 V
- Vollständig entladene Spannung: ~ 12,23 V
- Optimaler Gebrauchsbereich: 50% bis 100% (12,23 V - 12,89 V)
|
Stromspannung |
Kapazität |
|
12.89v |
100% |
|
12.78v |
90% |
|
12.65V |
80% |
|
12.51V |
70% |
|
12.41V |
60% |
|
12.23V |
50% |
|
12.11v |
40% |
|
11.96v |
30% |
|
11.81v |
20% |
|
11.70v |
10% |
|
11.63v |
0% |
Überflutete Batterien sind billiger, erfordern jedoch eine regelmäßige Wartung, einschließlich der Nachfüllung mit destilliertem Wasser und der sicheren Belüftung.Sie haben eine etwas niedrigere Vollspannung im Vergleich zu AGM-Batterien.
- Vollladspannung: ~ 12,64V
- Vollständig entladene Spannung: ~ 12.07V
|
Stromspannung |
Kapazität |
|
12.64v |
100% |
|
12.53V |
90% |
|
12.41V |
80% |
|
12.29v |
70% |
|
12.18v |
60% |
|
12.07v |
50% |
|
11.97v |
40% |
|
11.87v |
30% |
|
11.76v |
20% |
|
11.63v |
10% |
|
11.59V |
0%
|
Durch die Verwendung dieser Spannungsdiagramme können Sie Ihre Lead-Sacid-Batterien überwachen und aufrechterhalten und ihre Lebensdauer und Leistung in Ihrem Solar-Setup maximieren.
Arten von Lithium-Ionen-Batteriespannungsdiagramme
Lithium-Ionen-Batterien, insbesondere Lithium-Eisen-Phosphat (LIFEPO4) -Batterien, werden aufgrund ihrer langen Lebensdauer, der geringen Wartung und ihres hohen Sicherheitsstandards immer beliebter für Sonnensysteme.Im Gegensatz zu Blei-Säure-Batterien benötigen sie keine vollen Ladungen und können effektiv über einen weiten Bereich von Ladungszuständen funktionieren.Sie sind auch weniger anfällig für Spannungsschwankungen und können ohne Belüftung gespeichert werden.Lithium-Batterien sind mit integrierten Batteries-Management-Systemen (BMS) ausgestattet, die sie vor Überhitzung, Überladen und tiefen Entladungen schützen und eine zusätzliche Sicherheitsschicht hinzufügen.
12 V Lithium-Ionen-Batteriespannungstabelle
Das 12-V-Lithium-Ionen-Batteriespannungsdiagramm ist ein wichtiges Instrument zur Überwachung des Lade- und Leistungszustands der Batterie.Mit diesem Diagramm können Sie die Spannungsniveaus während des Aufladens und Entladens verstehen und eine bessere Wartung und Lebensdauer der Batterie ermöglichen.Ob in Elektrofahrzeugen, tragbaren Elektronik oder erneuerbaren Energiesystemen, eine genaue Spannungsverfolgung ist der Schlüssel zur Optimierung der Batterieeffizienz und -sicherheit
|
Stromspannung |
Kapazität |
|
14,6 V |
100% (Ladung) |
|
13,6 V |
100% (Ruhe) |
|
13,4 V |
99% |
|
13,3 V |
90% |
|
13.2v |
70% |
|
13.1V |
40% |
|
13.0v |
30% |
|
12,9 V |
20% |
|
12,8 V |
17% |
|
12,5 V |
14% |
|
12.0v |
9% |
|
10.0v |
0% |
48 V Lithium-Ionen-Batteriespannungstabelle
Das 48-V-Lithium-Ionen-Batteriespannungsdiagramm dient als wichtige Referenz für das Verständnis der Lade- und Entladungseigenschaften der Batterie.Mit diesem Diagramm können Sie die Spannungsniveaus einfach überwachen, eine gute Leistung sicherstellen und die Lebensdauer der Batterie verlängern.Dieses Spannungsdiagramm ist häufig in Elektrofahrzeugen, Solarenergiesystemen und verschiedenen Hochleistungsanwendungen eingesetzt. Er ist für eine effektive Batterieverwaltung und -wartung sowie die Förderung der Sicherheit und Effizienz im Betrieb
Für größere Sonnensysteme kann ein 48-V-Lithium-Ionen-Batterieaufbau besser geeignet sein.Hier finden Sie einen kurzen Blick auf die Spannungsniveaus, die mit einer 48-V-Lithium-Ionen-Batterie verbunden sind.
|
Stromspannung |
Kapazität |
|
57,6 V |
100% (Ladung) |
|
54,4 V |
100% (Ruhe) |
|
53,6 V |
99% |
|
53,2 V |
90% |
|
52,8 V |
70% |
|
52,4 V |
40% |
|
52.0v |
30% |
|
51,6 V |
20% |
|
51.2v |
17% |
|
50.0v |
14% |
|
48.0v |
9% |
|
40,9 V |
0% |
Ladespannungshandbuch des Akkus
Die Spannung einer Batterie kann einen guten Hinweis auf den Ladungszustand liefern.Bei Blei-Säure-Batterien können spezifische Schwerkraftwerte mit einem Hydrometer ein genaueres Maß an Ladung ermöglichen.Bei Lithium-Ionen-Batterien sind Spannungswerte tendenziell stabiler, was es einfacher macht, mit nur einem Voltmeter zu überwachen.
|
Prozentsatz
der Ladung |
12V
Batteriespannung |
Spezifisch
Schwerkraft (Blei-Säure) |
|
100% |
12.70v |
1.265 |
|
95% |
12.64v |
1.257 |
|
90% |
12.58 V |
1.249 |
|
80% |
12.46v |
1.233 |
|
50% |
12.20 V |
1.190 |
|
0% |
11.90V |
1.120 |
Entladungskapazitätstabelle der Batterie
Die Batterieausflussraten variieren je nach Last, die an den Akku angelegt wurde.Größere Batterien mit höheren AMP-Stunde (AH) können höhere Entladungsströme ohne Spannungsabfall unterstützen.Die folgende Tabelle enthält maximale Entladungsraten für verschiedene Batteriekapazitäten.
|
Batterie
Kapazität (AH) |
7 Minuten
Maximaler Entladungsstrom |
30 Minuten
Maximaler Entladungsstrom |
|
5AH |
15 Ampere |
10 Ampere |
|
10AH |
31 Ampere |
21 Ampere |
|
22AH |
66 Ampere |
46 Ampere |
|
35AH |
105 Ampere |
84 Ampere |
Abschluss
Durch die Auswahl der richtigen Batterie für ein Sonnensystem besteht das Verständnis der Spannungseigenschaften jedes Batteriestyps und der Art und Weise, wie sie Ihren Anforderungen übereinstimmen.Blei-Säure-Batterien sind erschwinglich, erfordern jedoch Wartung, während Lithium-Ionen-Batterien Haltbarkeit und niedrige Unterhalt bieten, wenn auch zu höheren anfänglichen Kosten.Durch die Verwendung von Batteriespannungsdiagrammen können Sie die Leistung Ihrer Batterie überwachen und optimieren, um sicherzustellen, dass Ihr Solarsystem für die kommenden Jahre effizient ausgeführt wird.
Verwandter Artikel
-
Nov 01 2024Verständnis des Wertes und des Gewichts von Golfwagen
Golfwagen sind für verschiedene Zwecke über den Golfplatz, einschließlich des persönlichen Transports in Gemeinden und sogar in den Freizeitgebrau... -
Oct 29 2024Leitfaden für digitale Signalprozessoren
Digitale Signalprozessoren (DSPs) sind ein wesentlicher Bestandteil der modernen Technologie und ermöglichen die effiziente Verarbeitung digitaler Si...
Verwandte -Produkte

BU16006KV-E2
IC VIDEO SWITCH 64VQFP
TLE2425MD
IC VREF GND REF 0.8% 8SOIC
V48C12H150B
DC DC CONVERTER 12V 150W

PM20CTM060
IGBT Modules

TEF6901AH/V2
TEF6901AH/V2 NXP

BT481KPJ85
BT481KPJ85 BT

ICB2FL03G
ICB2FL03G INFINEON

PSD813F2-A-70M
PSD813F2-A-70M WSI
MAX5154BCEE+
IC DAC 12BIT V-OUT 16QSOP

SST29VE020-200-4I-NH
SST29VE020-200-4I-NH SST

GSC4558/SOP-8L
GTM SOP-8L

MB87R1171
Relevanzprodukte
2V7002KT1G
MOSFET N-CH 60V 320MA SOT23
vorrätig: 1598


